
Daily drilling reports and sensor data, in one view.
Combine written reports and sensor feeds into standard progress curves, so comparing wells takes minutes instead of an afternoon in spreadsheets.
Daily progress
Aggregated from daily reports and sensor exports
Progress stalled for roughly 18 hours on days 4 to 5, then resumed below the planned rate. Flagged for an engineer to review.
Illustrative interface, sample data. Built around your systems on a real project.
From your data to a decision your team approves.
In
Your documents and systems
We ingest daily reports and sensor exports from the formats you already receive.
The data is normalized into one structure, with depth-versus-day curves generated per well.
Unusual readings and gaps are flagged for an engineer to review.
Out
Your team reviews and approves
Drilling data arrives in different formats from different sources. Engineers spend hours normalizing it before they can ask a single useful question.
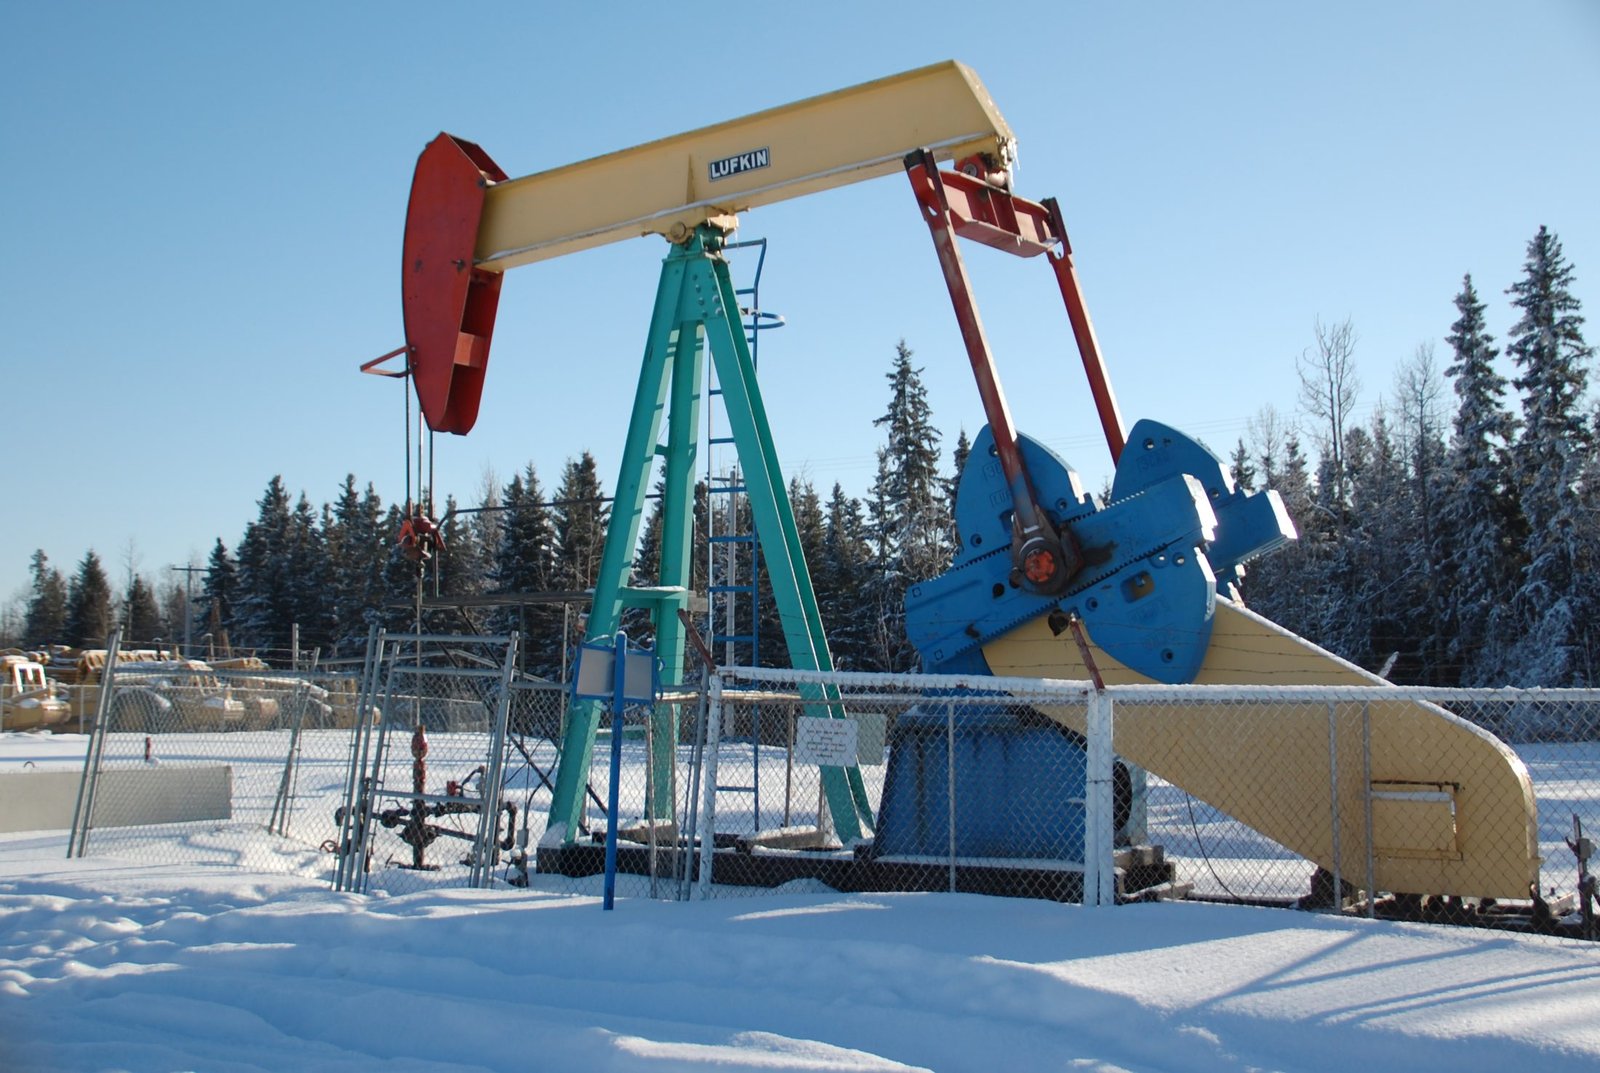
What your team gets
Depth-versus-day curves per well
Cross-well comparison
Anomaly and gap flags
Plain-language daily summaries
Can this run without internet access?
Yes. Energy sites often need an air-gapped deployment, and the system is designed to support that.
Does it control equipment?
No. It reads and reports on data. It does not send commands to rigs or SCADA systems.
What data formats can it read?
CSV, Excel and PDF reports are typical. Other formats are scoped during the audit.
Pairs well with
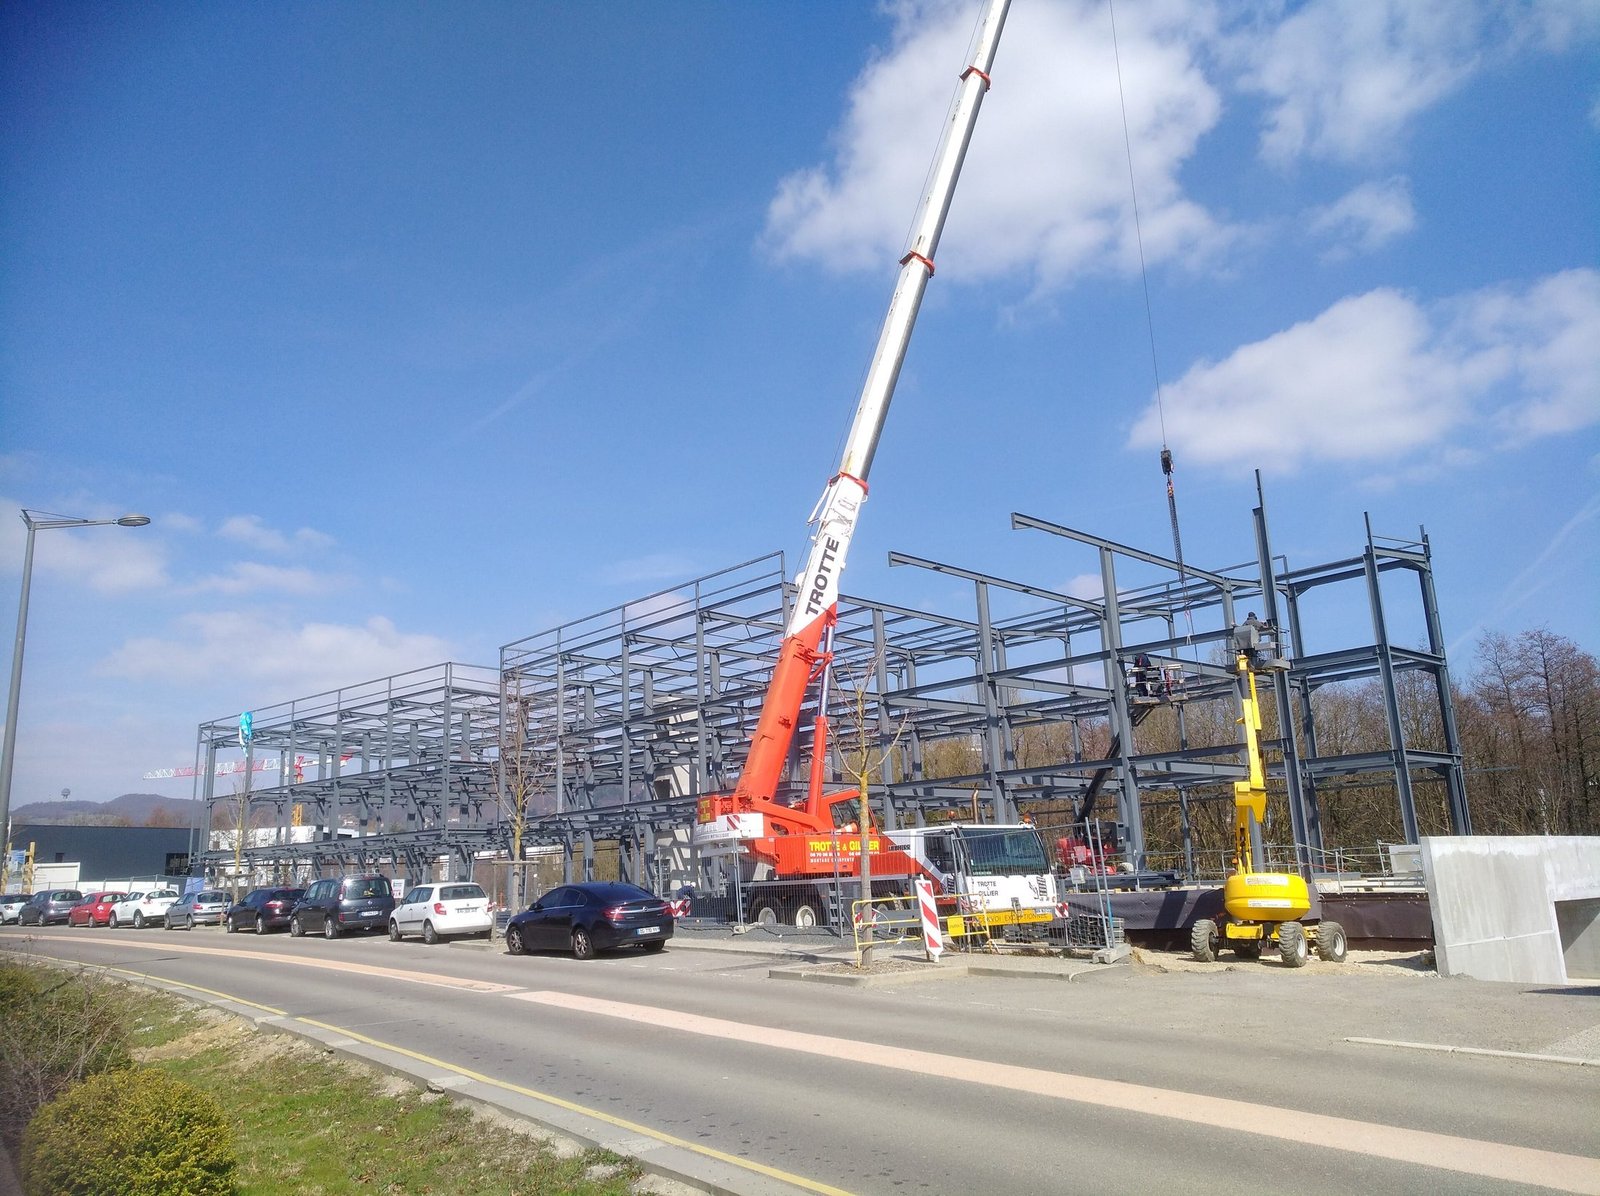 Construction and infrastructure02
Project and field reporting
Daily logs, texts and subcontractor updates get turned into one readable summary per project, with blockers called out before they cascade.
 Corporate data06
Natural language reporting
Type a question like "which vendors had contracts over $50,000 last quarter?" and get a table, a chart and the query behind it.
- Construction and industrial08
Safety and compliance packages
Safety packages, permits and subcontractor paperwork are checked against your required list, with expired or unsigned items flagged and follow-ups drafted.
Have a workflow like this?
Tell us what slows your team down. We will tell you honestly whether software can help.