
Know which truck needs service before it is on the side of the road.
Telematics readings, inspection notes and service history are combined into a maintenance forecast for every unit, with the reasons shown.
Illustrative interface, sample data. Built around your systems on a real project.
From your data to a decision your team approves.
In
Your documents and systems
We connect to telematics exports, inspection notes and your service records.
The system tracks trends per unit and flags readings that drift from normal, with the supporting data.
A fleet manager reviews the forecast, schedules service, and assigns loaners from one view.
Out
Your team reviews and approves
Service happens on a calendar or after a breakdown. The signals were in the data weeks earlier, spread across systems nobody has time to compare.
What your team gets
Health score per unit
Predicted service windows
Plain-language reasons for each flag
Downtime and cost summary
Does it control the vehicles?
No. It reads and reports on data. It does not send commands to vehicles.
How accurate are the forecasts?
That depends on your data. We test against your history during the build and report the results honestly before launch.
What data do we need?
Telematics or sensor exports and service records are typical. We scope the rest during the audit.
Pairs well with
- Supply chain05
Logistics and dispatch
Carrier tracking and order data are watched together, so stuck or delayed shipments surface early and customers get a clear update.
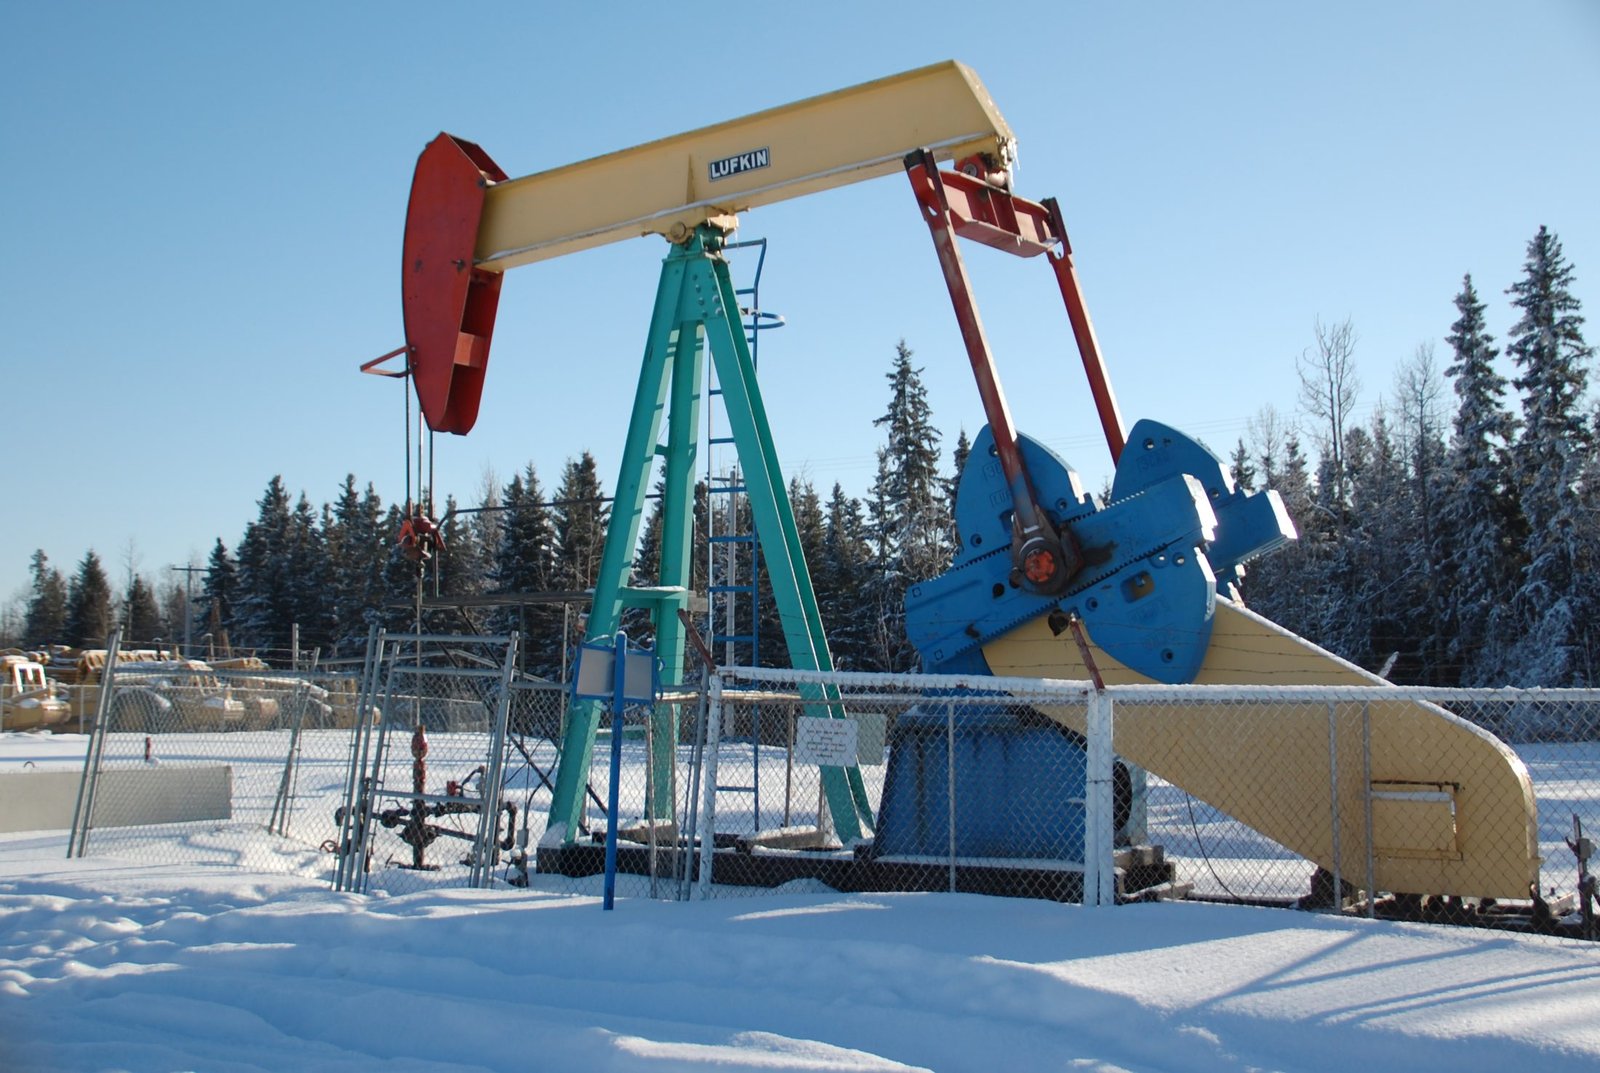 Energy03
Drilling and sensor reporting
Combine written reports and sensor feeds into standard progress curves, so comparing wells takes minutes instead of an afternoon in spreadsheets.
- Distribution and retail10
Inventory and reordering
Usage history and current stock levels are combined to suggest what to order, so shortages are caught before they stop work.
Have a workflow like this?
Tell us what slows your team down. We will tell you honestly whether software can help.